Understanding Disk I/O Latency
It has been a while since we posted something about troubleshooting disk I/O latency issues in Exchange Server. Traditionally, disk latency is one of main areas to explore if you are seeing performance issues with Exchange Server. Over the years, Exchange Server has become very efficient with disk use, but adding users to the server over time can cause performance problems that creep up on you slowly. We hope this blog post helps you understand these problems.
In most cases, when dealing with performance issues caused by I/O to disk latency, you can verify that something is wrong by using the “LogicalDisk(*)Avg. Disk sec/Read” and “LogicalDisk(*)Avg. Disk sec/Write” performance counters. High average times or extremely high spike times are telltale signs. Logical Disk counters are measured at the Volume Manager of the stack prior to reaching the Microsoft Port Driver Queue (Storport.sys) and is the Average Time spent (in seconds) of all completed I/Os during on the data collection interval. Because we are averaging all I/Os completed during that interval, it can become more critical to use a shorter sample interval for performance captures. This helps capture an issue that might be occurring only for a few seconds or minutes where long I/Os become averaged out to a lower value and therefore don’t seem like such a big deal.
By default, Exchange has daily performance logs that are automatically collected. However, data collection uses a 1-minute interval and does not collect additional counters that are needed to properly determine a disk latency issue. So, you still need to collect additional performance data to properly determine an issue, because logs are averaging all I/Os between each data point and this can easily skew our data view. When you can clearly see a disk latency issue within the daily performance logs, it means you truly have an issue because the long sample interval isn’t averaging out the data to be within our accepted performance thresholds.
In most performance issues caused by disk I/O latency, you can verify the issue based off these counters and you can expect that there is an issue in something other than Windows. After years of looking into performance issues caused by disk I/O latency, I think I might have seen a single case (out of hundreds) that was adding to the latency that we were seeing and caused by something in Windows. The majority of issues end up being beyond Windows control.
Keep in mind this latency is measured from the Volume Manager down the rest of the stack to the disk subsystem. The disk subsystem not only includes the hard drives, but also the cables and controllers that connect them to the computer. When a storage team looks at the data for disk I/O latency, depending on where they are looking and how they are collecting their data, they could be overlooking part of the disk subsystem where the latency can crop up. When you see a large discrepancy between the Windows counters “LogicalDisk(*)Avg. Disk sec/Read” and “LogicalDisk(*)Avg. Disk sec/Write” and the data provided by the storage team, you need to validate a few things:
- What is physically in between the two different pieces of data being collected? Can we check latency there, if possible (cables, HBA cards, etc.)?
- How is the data collected and being displayed/interpreted? It is important that you compare similar data collection types. If one set collects disk I/O average latency at 5 second intervals and another set collects it at 1-minute intervals, the comparison can provide inaccurate conclusion of where the issue might be.
- Look at the data from the hardware side when latency is seen on the Windows side, as well. Many times, disks were looked at when we were no longer seeing an issue at the Windows level, which is why it is critical to collect data on all levels at the same time to compare.
If you still have a data discrepancy as to where the issue is at, you can collect a Storport trace (the driver that handles I/O in Windows). At this level of data collection, performance is the responsibility of the disk subsystem. For more information on Storport tracing, read this article.
Example disk latency scenario
In some extremely rare cases, it might be harder to determine a disk I/O issue because throughout normal business hours everything appears fine as the server is averaging only 1 ms for disk I/O latency and spiking up to 22 ms at times. As this is within the acceptable thresholds for disk I/O latency, you might not suspect a problem. However, other indications can help identify a disk I/O issue, such as Application log event 533, shown below. This event indicates there was an issue with a write request for a database, and that the write request has not completed after 28 seconds.
LogName: Application
Source: ESE
Event ID: 533
Date: 5/6/2019, 6:31:12 PM
Task Category: General
Level: Warning
User: N/A
Computer: ServerA.contoso.com
Description:
Information Store – DB11 (22832) DB11: A request to write to the file “S:DB11DB11.EDB” at offset 93518757888 (0x00000015c6270000) for 32768 (0x00008000) bytes has not completed for 28 second(s). This problem is likely due to faulty hardware. Please contact your hardware vendor for further assistance diagnosing the problem.
Because the write request to a database didn’t complete, it triggered failover of the database.
This Application event is “higher up” in the stack so it is possible there might be a culprit above the disk subsystem. However, most causes for this type of issue end up being a problem in the disk subsystem. It could be the disks or something on the path to the disk. So, when you see an event like this, the first thing to look at is disk I/O latency. If you see latency there, there is no need to look at the application layer as the latency can already be seen in the Volume Manager.
Below is a capture of “LogicalDiskAvg. Disk sec/Write” counters for DB11 on the S: drive taken during business hours. Based on this capture, everything appears to be okay.
But we know there is an issue with the disk due because of the ESE Event 533 we saw earlier. A good indicator counter that your disks are stressed or could be on the verge of having an issue is the “LogicalDisk(*)% Idle Time” counter. This counter is a precise measurement of how much time the disk was in the idle state. Idle state is when all requests from Windows to the disk have completed and nothing is pending. If this counter gets extremely low, it indicates there is an issue you can address by replacing faulty hardware or upgrading drivers or firmware. It might also indicate that you don’t have fast enough disks for the I/O load. This could indicate that your disk I/O needs have increased since you sized and built the environment.
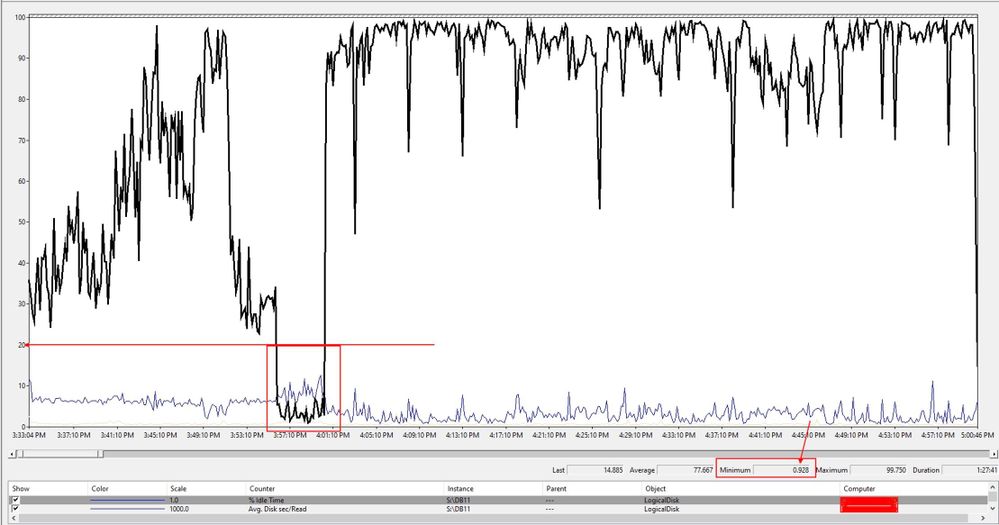
Below is the “LogicalDisk% Idle Time” counter and what it looked like:
When viewing this counter, there is a good indication that there is a disk I/O issue. We see 0.928 for a minimum value on “% Idle Time” counter and for a period of about 5 minutes it was averaging below 10. This is a good indication to start looking at the disk subsystem for issues.
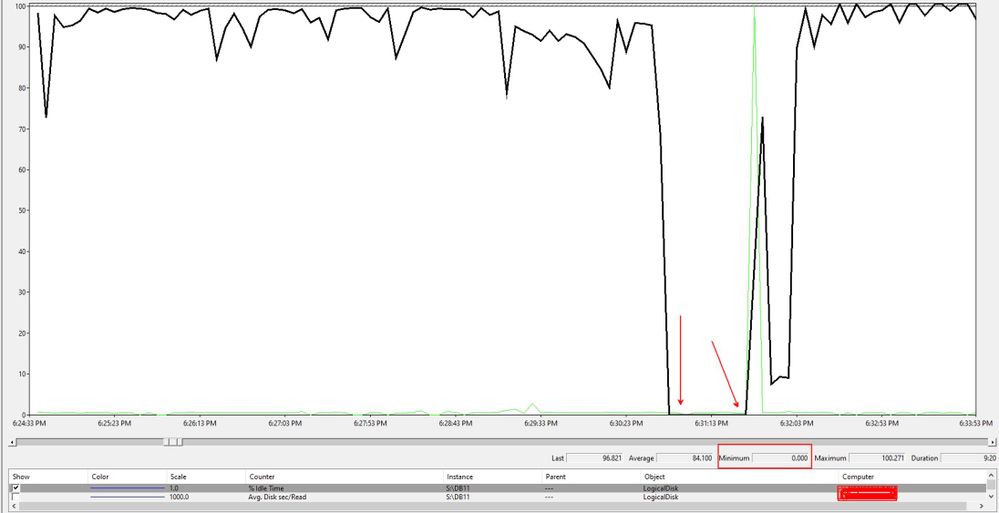
However, this didn’t line up with the time of Event 533, so you need to look at that timeframe as to what was going on.
As you can see from the above captures, “% Idle Time” dropped to 0 for the entire time there is an outstanding I/O request, which is what Event 533 said. The counter for “Avg. Disk sec/Write” didn’t see a spike up to 28 seconds (as stated in Event 533), but the spike was about 10.940 seconds, which is bad. This discrepancy is because this counter is the average of all competed I/O requests during the collection interval. Therefore, the value is much lower than the event provided.
Now imagine if the performance data wasn’t collected at a 5 second interval. The I/O spike in Event 533 is already “hidden” from this capture, so we might not even see the value of this counter go above 1 second when collecting at a 15 second interval or higher.
With this information, there is more than enough evidence to prove this is a disk I/O latency issue, so you need to engage your storage team to assist with determining the cause. The % Idle Time counter should not be this low at random times when the server is doing roughly the same amount of work, and we shouldn’t have seen the large spike in the “Avg. Disk sec/Write” at the time of the issue. So, the problem could be anything from a bad cable to a misconfigured path failover. A misconfigured path failover is when there is a failure on the main path to the storage, but it doesn’t fail over to the secondary path.
Troubleshooting any performance issue can be tricky and complex when the issue isn’t abundantly clear and happens only intermittently. It is important to understand how the data is collected, what data points are being collected, and how frequently the counter is being measured or calculated. With a deeper understanding of the entire issue, it will be easier to determine the cause of the problem.
Few more references for additional reading:
- Windows Performance Monitor Disk Counters Explained
- Measuring Disk Latency with Windows Performance Monitor (Perfmon)
Happy Troubleshooting!
Read full article (Microsoft Exchange Blog)
All content and images belong to their respected owners, this article is curated for informational purposes only.


